Stop tracking performance in Excel
✔ Compare SLA performance across locations and providers
✔ Ensure SLA compliance and audit readiness at all times
✔ Monitor OTP, turnaround, and baggage KPIs across all stations
100+
Service Providers
100+
Service Providers
Unlock seamless collaboration
Unlock seamless collaboration
Unlock seamless collaboration
Every station. Every SLA. One performance view.
Service Providers become reliable Partners.
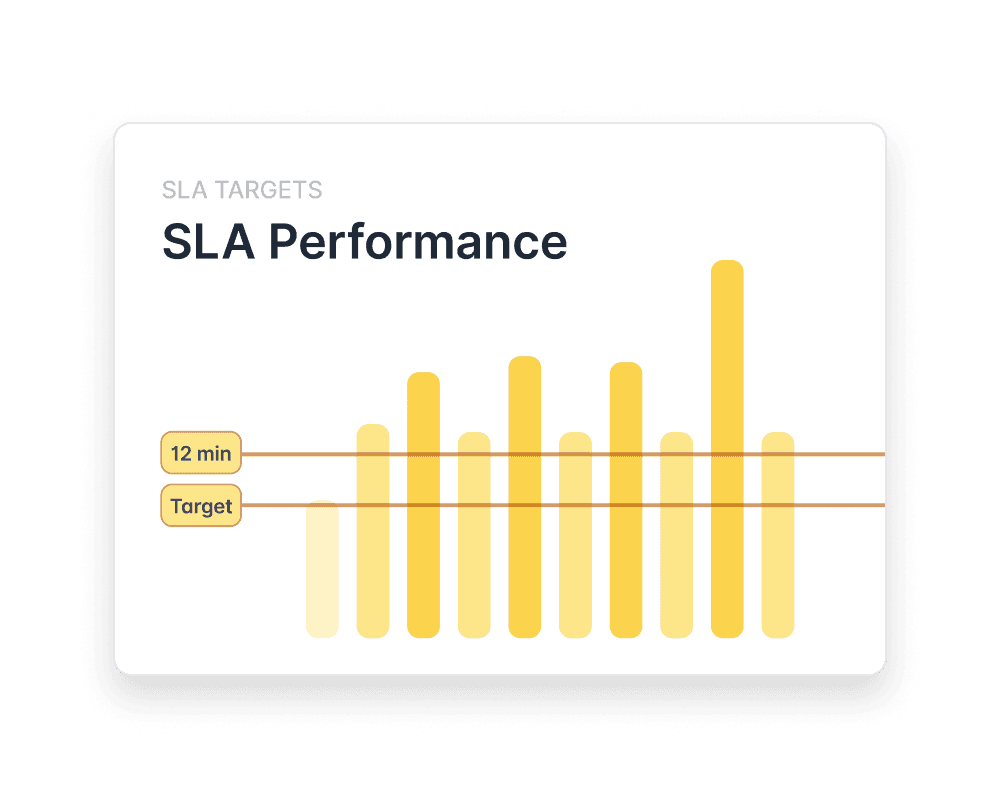
Performance Targets
Benchmark performance against contracts
Track how service providers perform against agreed SLAs by comparing actual performance with defined targets. This feature helps you monitor trends, identify issues, and ensure compliance, while linking directly to reporting for detailed analysis.
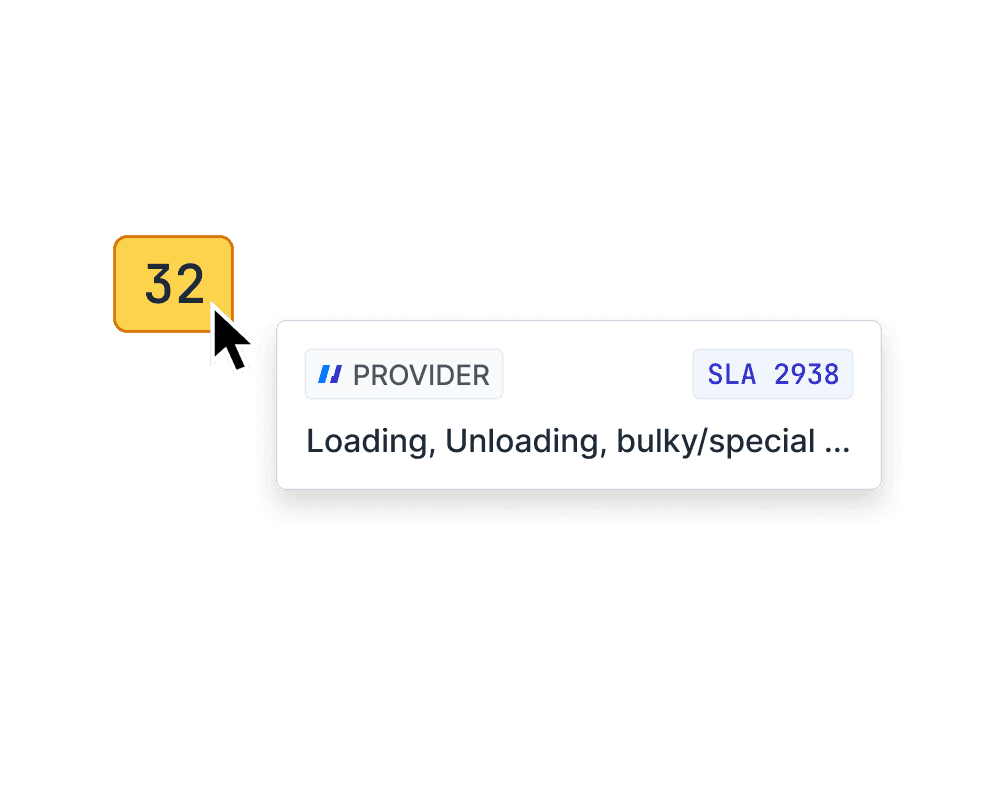
Provider Responsibility
Auto-assigned responsibility
Cosmos automatically links events to the responsible service provider, ensuring accountability. With clear ownership assigned, teams can collaborate effectively to resolve issues and improve performance. Linked to both delay and baggage modules for seamless event management. Less finger-pointing – more time to improve together!
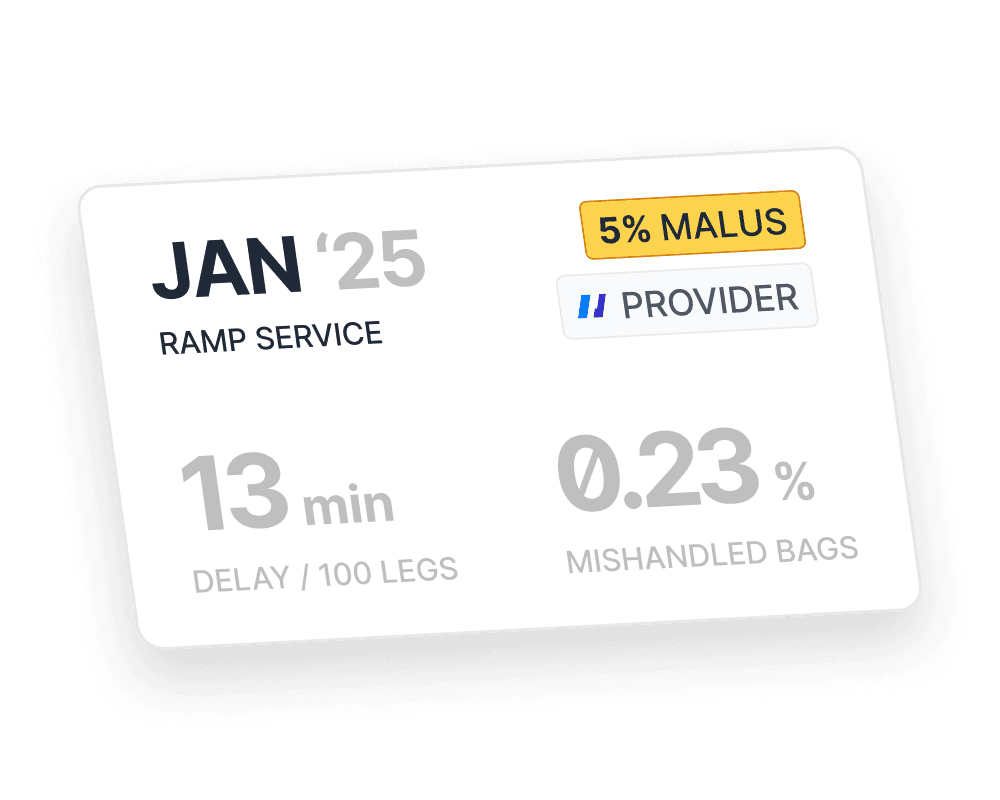
Monthly Reports
Monthly performance reports – generated automatically
Receive monthly performance reports for each station, provider, and service area. Spot bottlenecks, monitor SLA breaches, and drive accountability—all without manual data handling.
Monthly Reports
Monthly performance reports – generated automatically
Receive monthly performance reports for each station, provider, and service area. Spot bottlenecks, monitor SLA breaches, and drive accountability—all without manual data handling.
Monthly Reports
Monthly performance reports – generated automatically
Receive monthly performance reports for each station, provider, and service area. Spot bottlenecks, monitor SLA breaches, and drive accountability—all without manual data handling.
Read related articles on our Smooth Aviation Blog

Defining Effective KPIs for Aviation Ground Operations
May 9, 2025
Defining Effective KPIs for Aviation Ground Operations
May 9, 2025
Defining Effective KPIs for Aviation Ground Operations
May 9, 2025
Why It’s Time to Rethink SLAs
Apr 4, 2025
Why It’s Time to Rethink SLAs
Apr 4, 2025
Why It’s Time to Rethink SLAs
Apr 4, 2025
Next-level service collaboration.
Next-level service collaboration.
Next-level service collaboration.
Next-level service collaboration
Cosmos connects airlines, airports, and ground handlers. A single platform to manage services, contracts, and SLAs.


© 2025 Cosmos Solutions GmbH
Next-level service collaboration
Cosmos connects airlines, airports, and ground handlers. A single platform to manage services, contracts, and SLAs.
© 2025 Cosmos Solutions GmbH
Next-level service collaboration
Cosmos connects airlines, airports, and ground handlers. A single platform to manage services, contracts, and SLAs.
© 2025 Cosmos Solutions GmbH